I am having some trouble with Gong reporting and was hoping somebody in the community could help me out:
I am looking for a Gong report showing talk time Week over week by our account executives. I am trying to see if the % is starting to shift downward since we put our new playbooks into practice.
Is this possible with Gong?
Page 1 / 1
Hi Matt!
Great question, I’d love to jump in and hopefully help.
The short answer is that while there isn’t the time series reporting you’re likely envisioning available in product, there are a few easy ways to understand the impact these new playbooks have had.
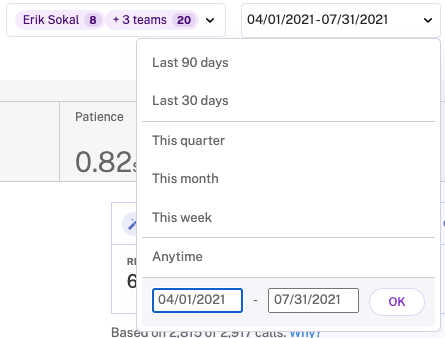
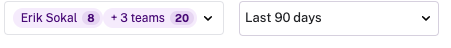
My recommendation is that you go to Team > Stats > Interaction and select the relevant leader(s) over your AEs and then in the dropdown that cover’s the time period, select a custom date range of 30-90 days, all pre-Playbooks.
Screenshot that rep and team level data and then repeat but for the last 30-90 days assuming all of that is post playbook enablement. Compare the results and see what you find.
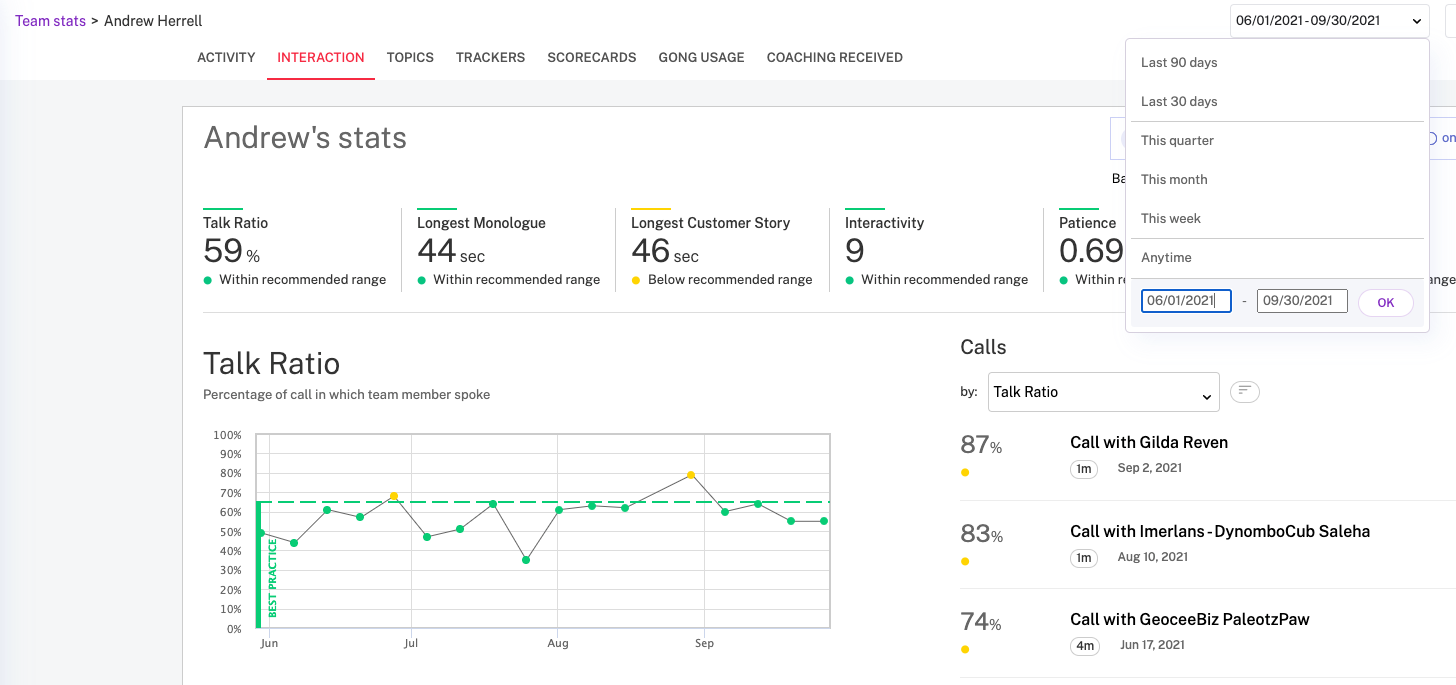
You might also be interested in looking at things on an individual rep level by clicking on a rep’s name in the list and navigating to their individual stats so you can see how they’re trending over the desired time period (perhaps 60 days before to 60 days after the playbook implementation). These data points on the graph are weekly averages
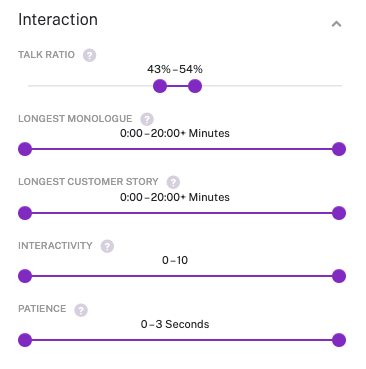
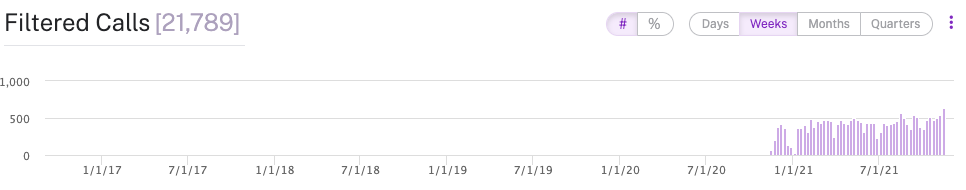
Another way you could approach this is through the Calls tab. Using your insights from the Team tab, go to the Calls tab, select Additional Filters on the left side and open up the Interaction category to find the Talk Ratio filter. Set the range (by dragging the dots at either end) to what you feel like is a desirable lower talk time range and then observe above in the graph whether you’re seeing more calls of that variety than before the playbooks were implemented.
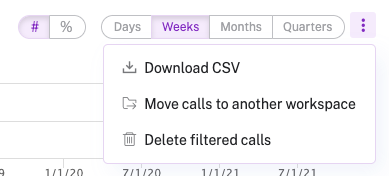
A final option that would likely get you the closest to what you’re envisioning but with a bit more effort would be downloading a CSV of several weeks of calls over the relevant period before and after playbook implementation(there is a Date filter option under the “Basic Details” filter family that’s available once you select “Additional Filters”) and then constructing the time series graphs you seek in Excel or a BI tool of your choice. If you don’t have download permissions already, you can talk to one of your Gong admins about either having them grant you them or having them do the download for you.
I look forward to hearing which of these workflows best serves your needs and more importantly, if your hypothesis proved to be true!
@Matt Metros did this answer help you? Just checking in to make sure you got what you needed.